



Why the Bitcoin ETF Story Matters More Than the Price
Bitcoin spent the first week of July 2026 trading in the low $60,000s after touching a 21-month low near $58,000—a sharp retreat from the highs it reached in October 2025. Traders across time zones...

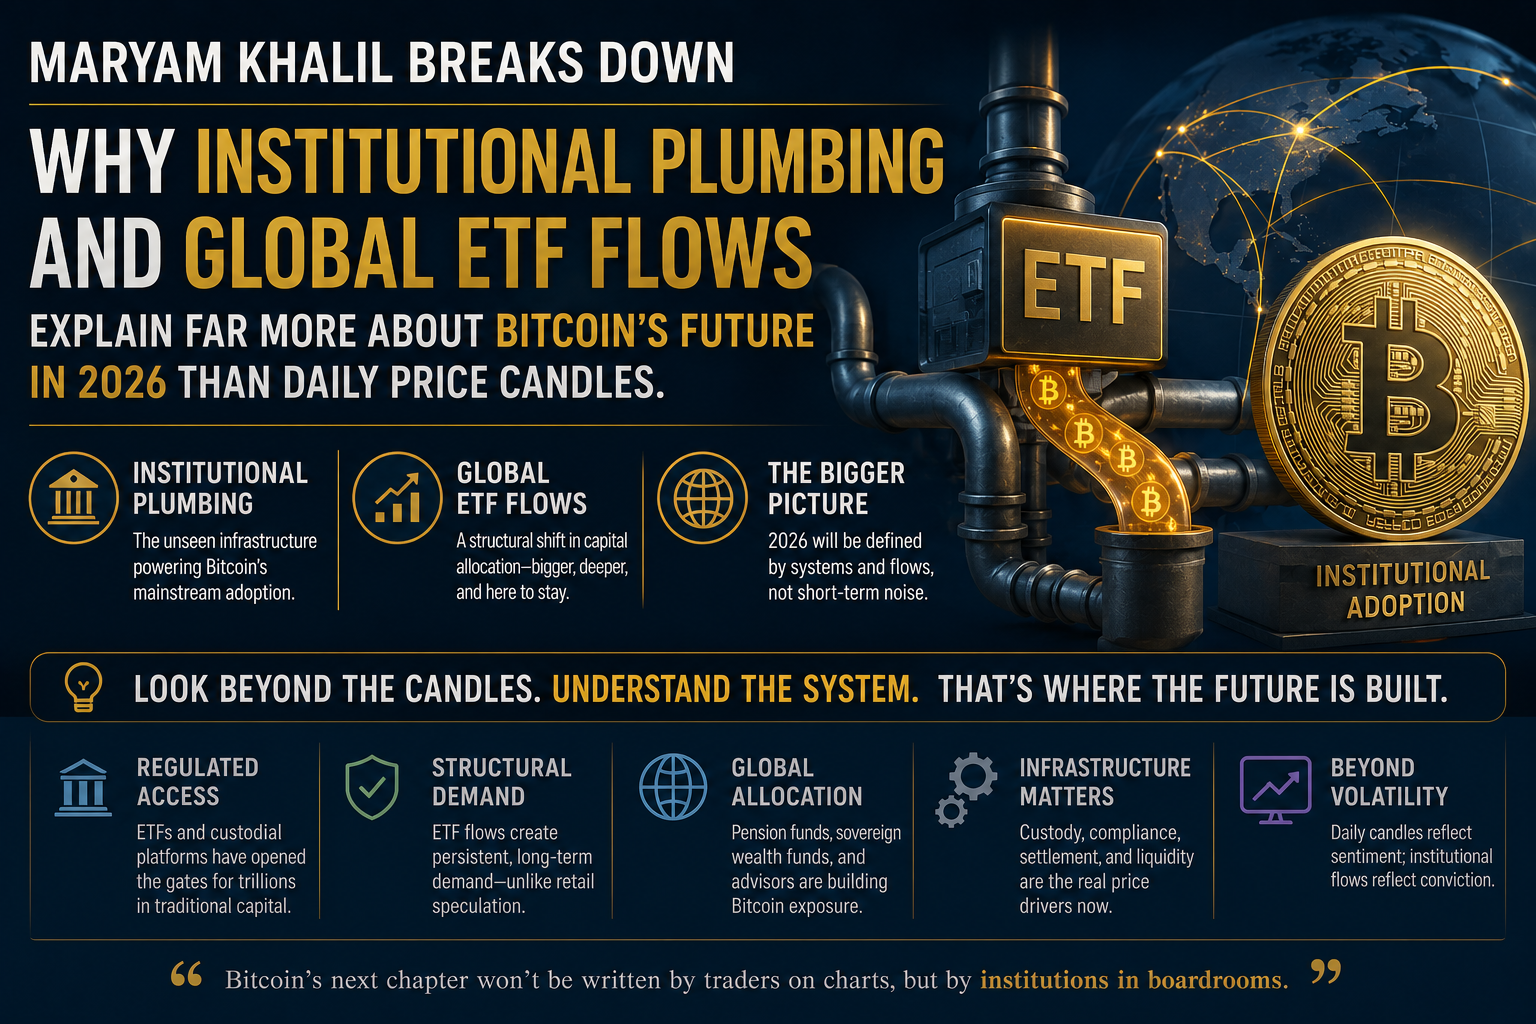
Bitcoin spent the first week of July 2026 trading in the low $60,000s after touching a 21-month low near $58,000—a sharp retreat from the highs it reached in October 2025. Traders across time zones fixated on the price candle, yet the more consequential story unfolded inside the institutional plumbing that now underpins a meaningful share of Bitcoin’s ownership. Understanding that plumbing, rather than the headline number, explains far more about where Bitcoin actually stands heading into the second half of 2026.
A Reversal That Needs Proper Context
United States-listed spot Bitcoin ETFs recorded three consecutive days of net inflows in early July, totaling roughly $510 million. That run ended a punishing ten-day stretch during which the same funds shed $2.73 billion.
BlackRock’s IBIT, the largest Bitcoin ETF by assets, led one of those sessions with $209 million on July 6. Analysts treat this print as a meaningful signal because IBIT’s investor base skews toward large, long-horizon institutional capital rather than tactical traders.
This reversal deserves genuine credit, but it also requires proportion:
June 2026 delivered approximately $4.5 billion in net outflows across the ETF complex, marking the worst monthly reading since these products launched in January 2024.
Since May 7, the sector has lost roughly $8.95 billion across 34 negative trading days, with only five positive sessions in that entire window.
Year-to-date net outflows across the US spot Bitcoin ETF complex still sit near $5.4 billion, meaning the July bounce recovered only a small fraction of what left the funds this year.
Why Fund Flows Move Prices
Research widely cited in 2026 market coverage estimates that ETF flows now explain approximately 45% of weekly Bitcoin price moves, a figure that reframes how investors should read daily flow data. The mechanism operates mechanically rather than emotionally. Authorized participants, typically large broker-dealers, deliver ETF shares to a fund’s custodian upon redemption, and the custodian must then sell the underlying Bitcoin on the spot market to return cash to investors.
Ten consecutive days of outflows therefore represented more than a billion dollars in systematic, rules-based Bitcoin selling per week—a volume that had nothing to do with any individual trader’s view on value.
Citigroup’s research desk quantified this price impact directly, estimating that every $100 million in net ETF inflows correlates with an approximate 53 basis point same-day price move, with the cumulative effect reaching nearly 96 basis points over ten trading days. Citigroup also cut its 12-month Bitcoin price target to $82,000 on July 1, its second downgrade of the year—a detail that adds useful ballast to any optimistic reading of the recent inflow streak.
The Global Picture Looks Different From Hong Kong
American coverage of Bitcoin ETFs tends to treat the US market as the entire story, but that framing misses an important structural shift underway in Asia.
Hong Kong’s spot Bitcoin and Ether ETFs, launched on the Hong Kong Stock Exchange (HKEX) in April 2024, expanded to nine listed products by August 2025. Several counters are denominated in Hong Kong dollars, US dollars, and renminbi specifically to attract capital from mainland Chinese investors alongside global institutions.
Market analysis from earlier in 2026 found that Hong Kong’s trading session increasingly sets the reference price that New York inherits at its own market open. Industry observers describe this dynamic as the erosion of Bitcoin’s historic “weekend gap”—the price discontinuity that once occurred between Friday’s US close and Sunday’s reopening when thin order books amplified every trade.
📄 POLICY WIRE WHITEPAPER PUBLISHED: PAKISTAN'S NATIONAL SECURITY POLICY PRIORITIES
👉 READ BY CLICKING HEREThat shift matters because it signals Bitcoin is becoming a genuinely follow-the-sun asset, defended and priced across Asian, European, and American trading hours rather than dictated by a single market. Investors outside the United States should watch Hong Kong Exchange flow data and mainland Chinese regulatory signals with as much attention as they give BlackRock’s daily print, since Beijing’s evolving posture toward crypto exposure through Hong Kong’s regulated ETF structure carries the potential to reshape global flow dynamics substantially in the years ahead.
Sentiment Has Collapsed Even as Whales Accumulate
The Crypto Fear and Greed Index, a composite gauge blending volatility, momentum, social sentiment, and options positioning, fell to a reading of 11 during the worst of the June selloff, deep in extreme fear territory. Historical patterns suggest such extreme readings often precede contrarian bounces, though the structural, rules-based nature of this particular outflow wave complicates that comparison. Programmatic ETF redemptions do not necessarily respond to sentiment extremes the way a leveraged futures liquidation cascade typically does.
Simultaneously, on-chain analytics from CryptoQuant showed large wallet holders accumulating more than 270,000 BTC over a recent two-week stretch, worth an estimated $16 to $17 billion at current prices. Analysts at Glassnode separately noted that long-term holders returned to accumulation after a prolonged distribution phase, with buying activity broadening across wallet cohorts, including entities holding between 100 and 1,000 BTC. This divergence between fleeing ETF capital and accumulating whale wallets represents the single most interesting tension in the current market, and it remains genuinely unresolved which force will dominate in the coming weeks.
A Structural Caveat Every Investor Should Understand
A technical nuance deserves wider attention before anyone treats a single day’s ETF flow figure as definitive proof of institutional conviction. Jeff Park, chief investment officer at ProCap and an adviser to Bitwise, has clarified that authorized participants operate under regulatory exemptions allowing them to meet ETF demand without immediately buying or selling Bitcoin on public exchanges.
A lag can separate a reported inflow from an actual spot purchase, and authorized participants sometimes draw down Bitcoin they already hold in inventory before transacting in the open market at all. This distinction should temper enthusiasm around any single green session, since the true measure of institutional conviction requires several consecutive weeks of consistent flow direction rather than one encouraging print.
Macro Forces Now Dominate the Price Story
Bitcoin’s price behavior in 2026 owes more to macroeconomic variables than to anything native to the cryptocurrency itself. A weak June jobs report showing only 57,000 new non-farm payrolls cooled expectations for further Federal Reserve rate hikes, and that single data point coincided directly with the ETF outflow streak breaking on July 2.
The Federal Reserve’s next meeting arrives July 28 and 29, and inflation data due July 14 will likely determine whether the recent inflow momentum extends or reverses. Investors following markets from outside the United States should recognize that European Central Bank policy, Bank of Japan rate decisions, and broader global bond yield movements carry similar weight for Bitcoin’s trajectory, since the asset now behaves as a high-beta risk instrument tightly correlated to global liquidity conditions rather than as the uncorrelated inflation hedge it was once marketed to be.
Reading the Charts
Bitcoin currently trades below its 50-month exponential moving average near $65,600, a level technicians treat as a proxy for medium-term trend health, while it continues holding above its 100-month exponential moving average near $40,300, meaning the multi-year bull structure remains intact despite the medium-term damage.
Critical Support: The $58,000 zone functions as the critical support level for bulls. A decisive break below it would likely open a path toward $55,000, with some analyst models extending the bearish case toward the $40,000 to $45,000 range should ETF outflows resume alongside deteriorating macro conditions.
Key Resistance: Reclaiming the $65,000 to $67,000 band would substantially repair sentiment and would help confirm the early-July bounce as a genuine trend reversal rather than a temporary reprieve.
The Bottom Line for a Global Audience
Bitcoin’s trajectory over the coming weeks depends on a genuinely global set of forces: American ETF flow data, Hong Kong’s expanding regulated crypto ETF infrastructure, mainland Chinese regulatory posture, and central bank decisions spanning multiple continents. Nobody can predict with real confidence whether Bitcoin heads toward $55,000 or reclaims $67,000, and any commentator claiming certainty in either direction deserves skepticism.
The data currently available paints a market in active tension: a historically difficult year for US ETF-driven demand, an extreme fear sentiment reading, a countervailing whale accumulation trend, and a structural shift toward Asian trading sessions setting global reference prices. That combination describes an asset in the middle of figuring out what it actually is now that a substantial share of its ownership sits inside regulated fund wrappers spanning multiple countries and currencies rather than in self-custodied wallets concentrated in any single region.
Author