

CNN Election Map Highlights Gas Price Spikes as Democrats Gain Ground in Midterms
CNN's 'magic wall' reveals a 73% gas price surge in Kansas counties as Democratic candidates challenge Republican incumbents in key midterm battles.

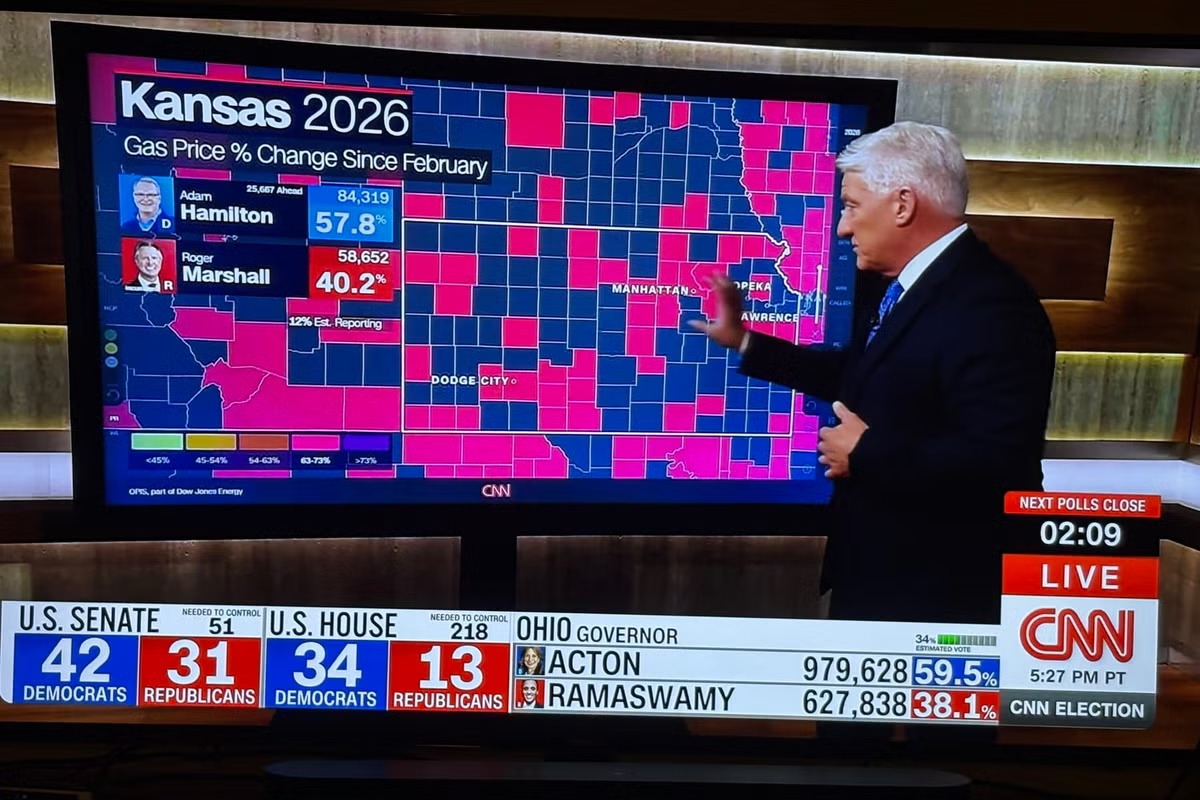
POLICY WIRE — Washington, USA — CNN utilized its signature ‘magic wall’ display on election night to highlight the dramatic rise in fuel costs alongside live midterm results as they began to roll in.
The network’s interactive data showcased specific regions where gasoline costs surged, reflecting the geopolitical fallout from President Donald Trump’s decision to initiate military conflict with Iran eight months prior to the vote. Following retaliatory strikes from the United States and Israel, Iran implemented a blockade of the Strait of Hormuz, which restricted the global oil flow and drove domestic-fuel prices to record highs.
Brian Steinberg, a senior TV editor at Variety, noted a specific map of Kansas where several counties were illuminated to show gas prices had climbed by 63 to 73 percent since February.
During the same period on Tuesday, the CNN map indicated Democratic candidate Adam Hamilton holding a lead over the Republican incumbent Roger Marshall. The tallies placed Hamilton at 57.8 percent compared to Marshall’s 40.2 percent.
According to data from the AAA Motor Club, the national average for a gallon of gasoline currently exceeds four dollars, representing an increase of nearly one dollar compared to the previous year. Democratic strategists leveraged the high cost of living and the ongoing foreign conflict to target Republican seats in an effort to reclaim control of Congress.
Reporting by Policy-Wire (PW)em>